China Pathfinder
Taking a deep dive into China's economy with the Atlantic Council
| Client | Atlantic Council |
| Role | Lead Engineer, Data Visualization Designer |
| Skills | Front-end Development, Data Visualization, UI/UX Design |
| Tech Stack | Svelte.js, D3.js, WordPress |
Overview
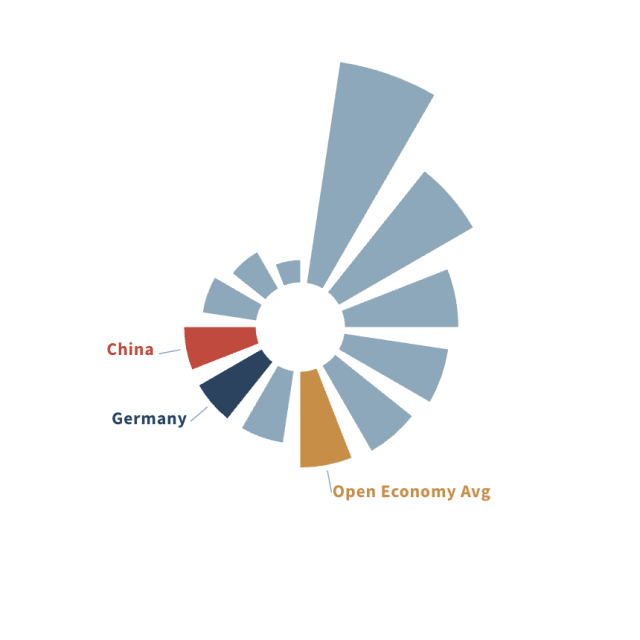
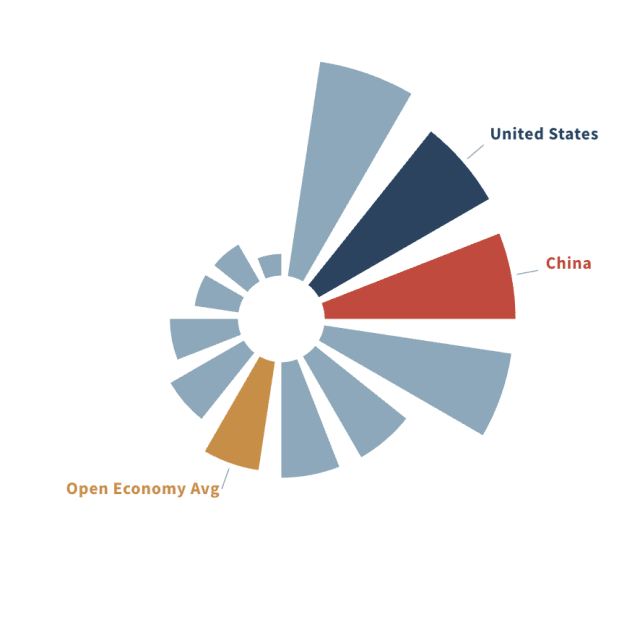
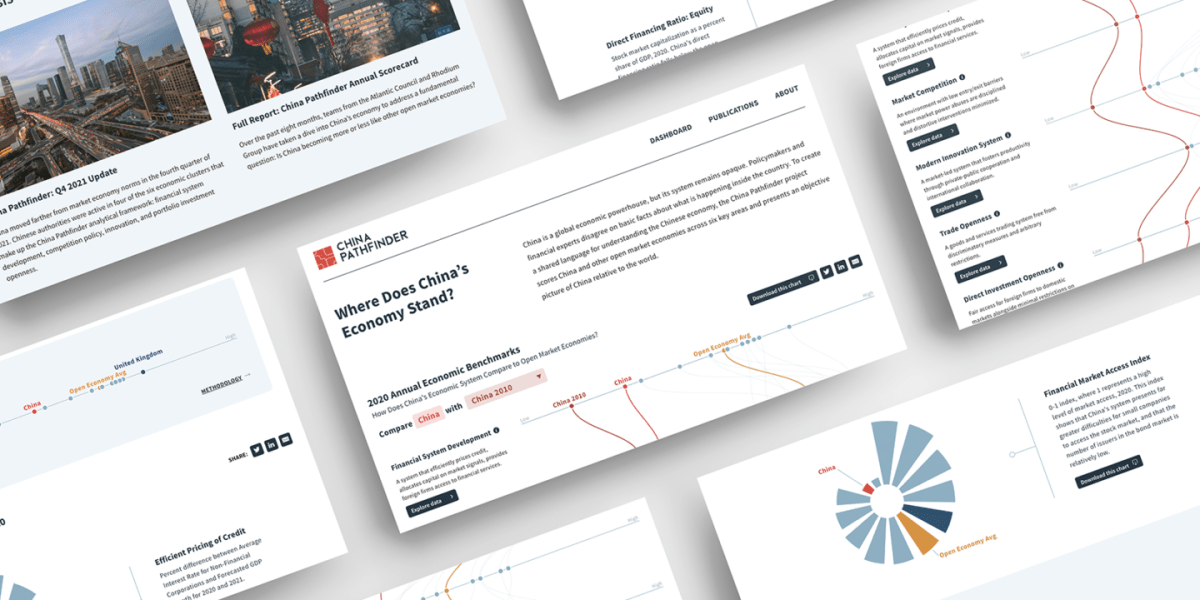
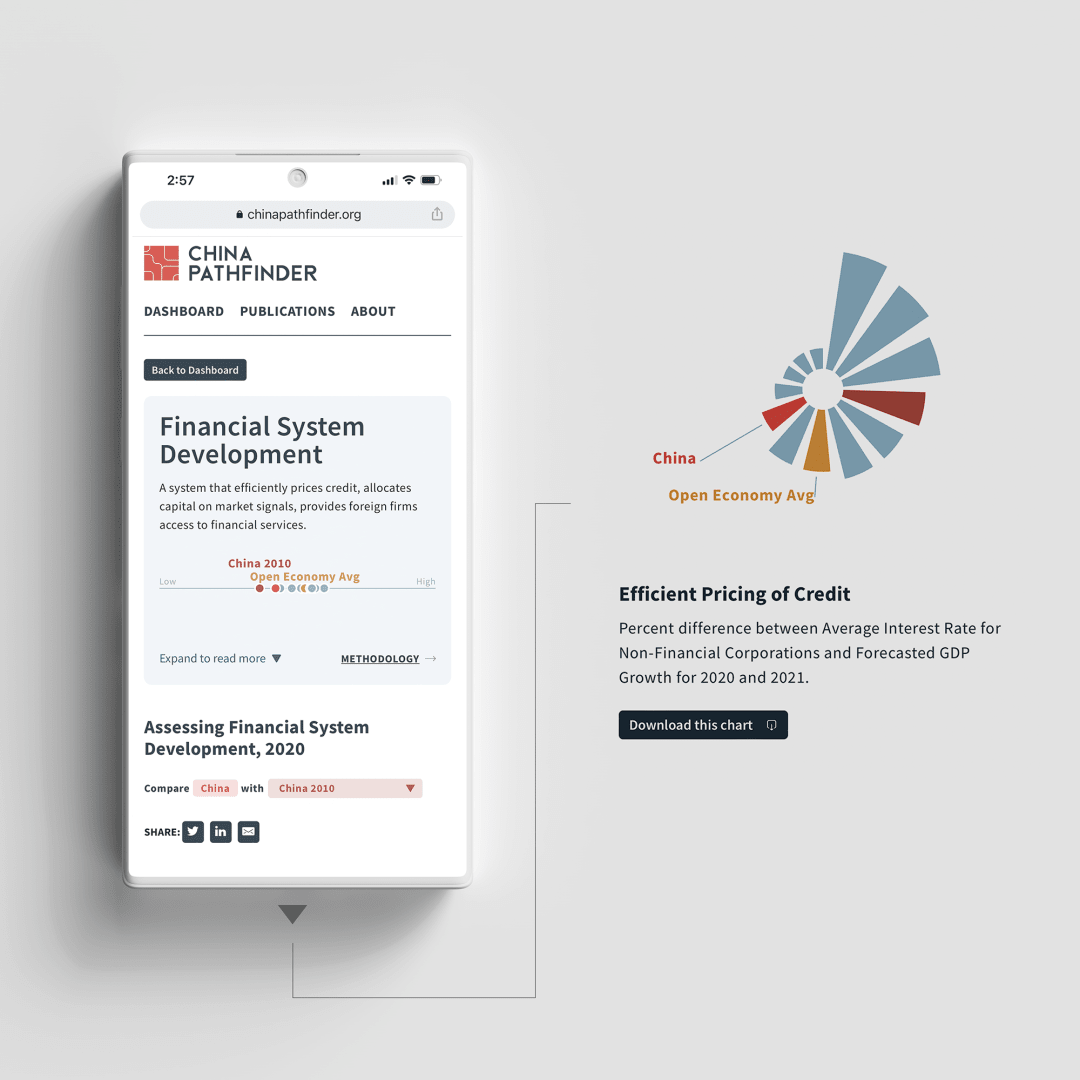
A data-driven microsite for The Atlantic Council Geoeconomics Center’s China Pathfinder initiative. The site features more than 30 custom data visualizations including a flagship dashboard visualization as well as visual deep dives into six financial indicators.
The Challenge
The project was built using an innovative combination of Svelte.js, D3.js and the WordPress CMS. The cutting edge Svelte JS framework allowed the application to be truly reactive, providing real time user feedback and instant interactions and page transitions without the need for a full page reload. Svelte also gave me the flexibility to develop the interactive using an agile approach, drastically reducing development time for changes in the code and allowing me to respond quickly as new algorithms for the economic projections were produced.
Data Visualization Design
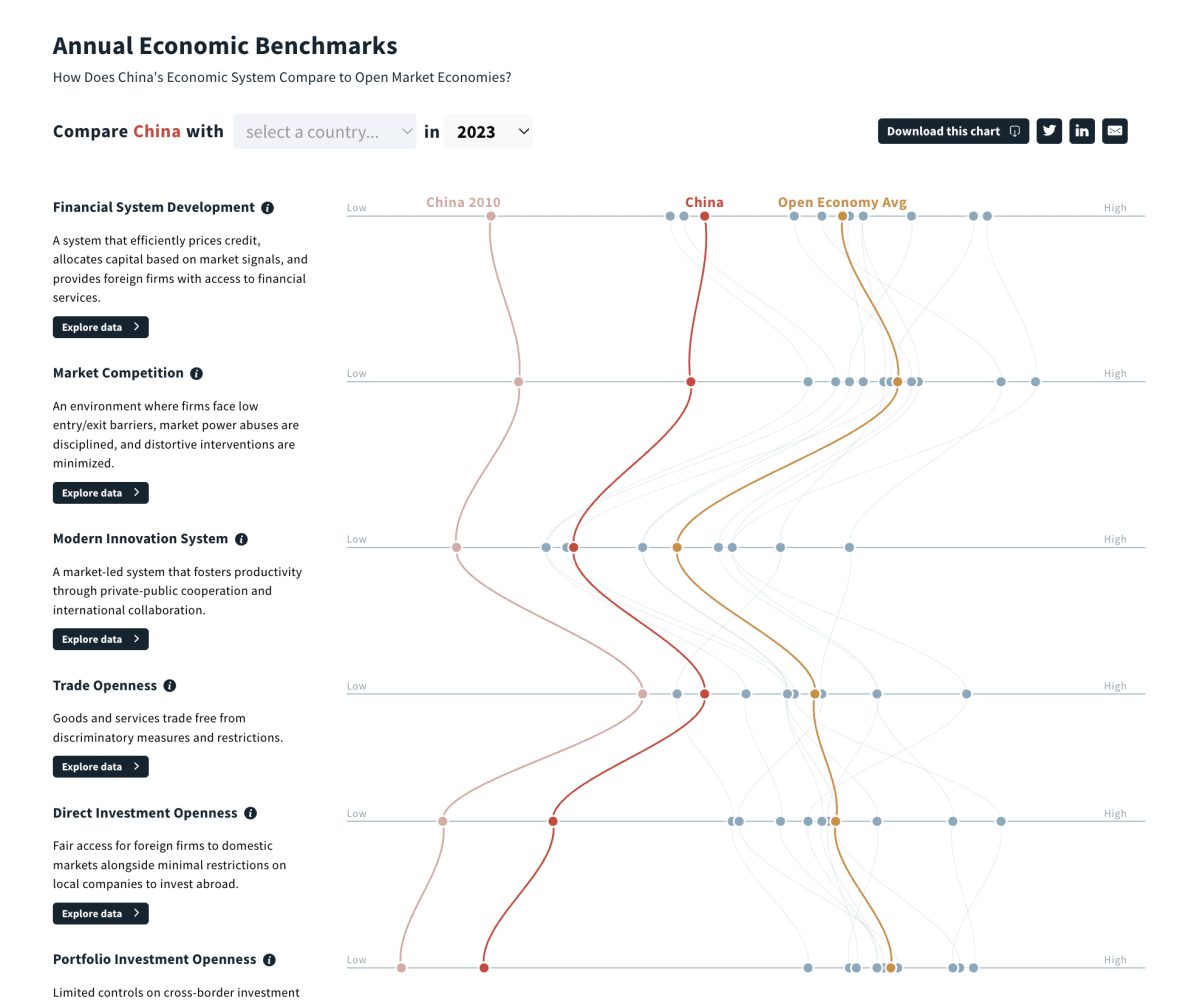
The data behind the interactive was unique and original, so I used the D3.js library to create the visualizations from the ground up, giving me the ability to tailor our graphics to the needs of the data rather than shoehorning the data into an existing chart template. The data-driven lines on the main homepage graphic were coded from a custom bezier curve algorithm, allowing the user to instantly see patterns in the economies of the countries displayed.
The Wordpress CMS gives the administrators complete control over all aspects of the website including content, page design and data. Each visualization is driven by a CSV file uploaded to a custom field on the WordPress backend, allowing the data to evolve over time without having to touch a line of code.