China Power Project
Creating a data visualization platform to analyze China's global influence
| Client | Center for Strategic and International Studies |
| Role | Lead Engineer |
| Skills | Front-end Development, Exploratory Data Analysis UI/UX Design, Data Visualization |
| Tech Stack | React.js, D3.js, Highcharts, R, Python, Google Maps API |
Overview
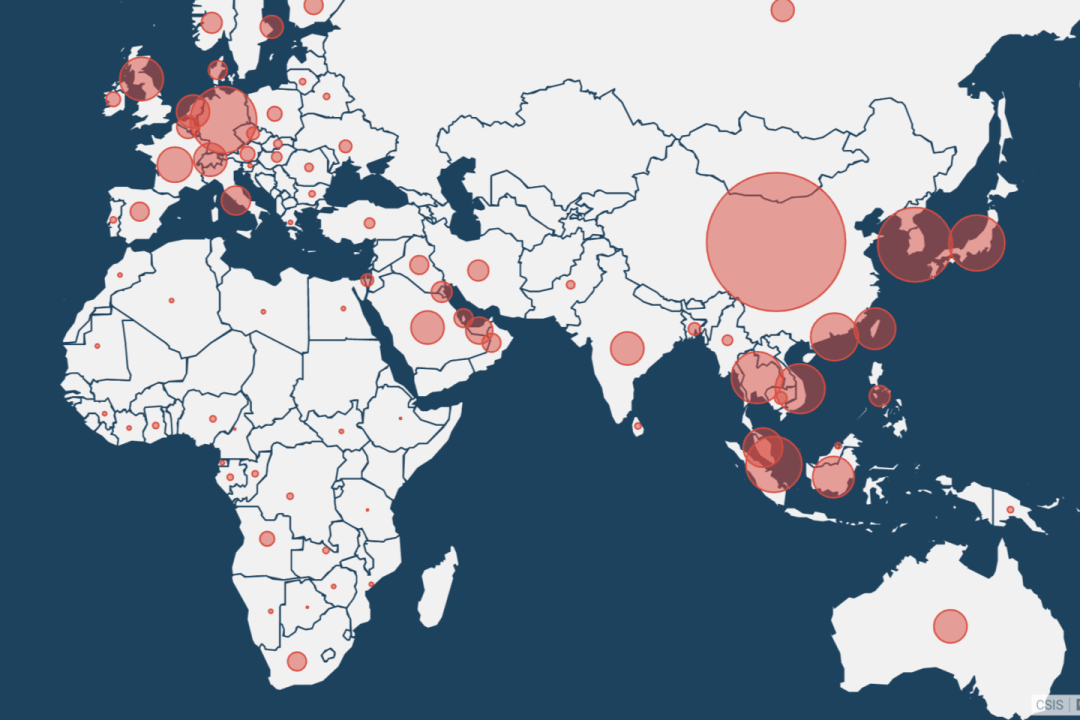
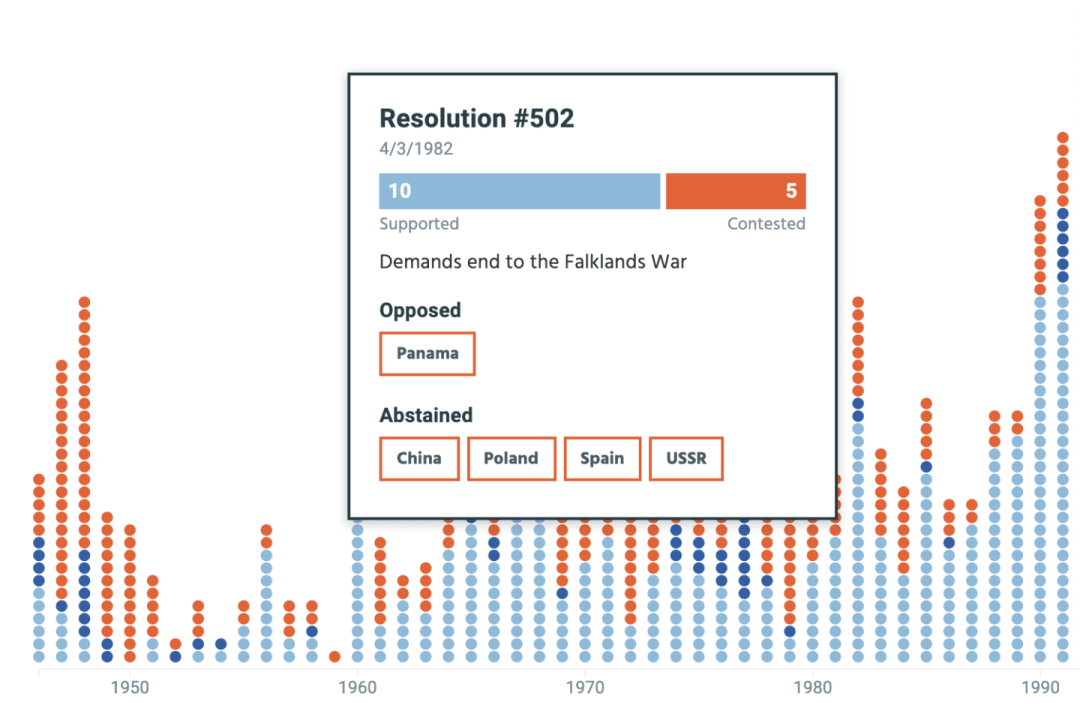
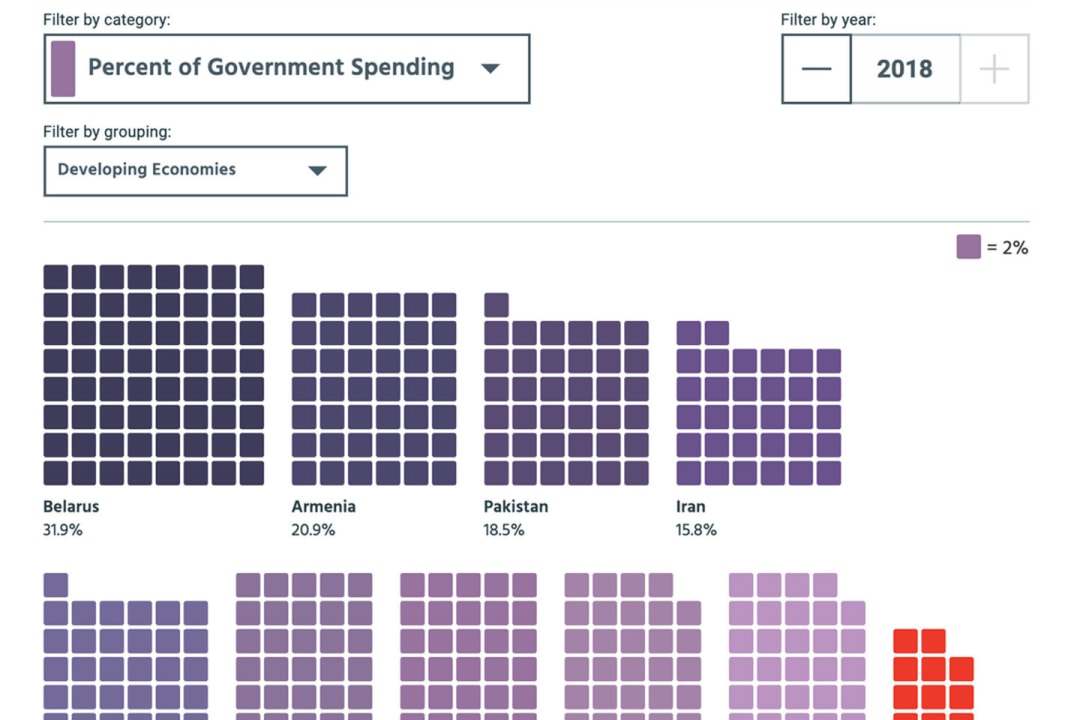
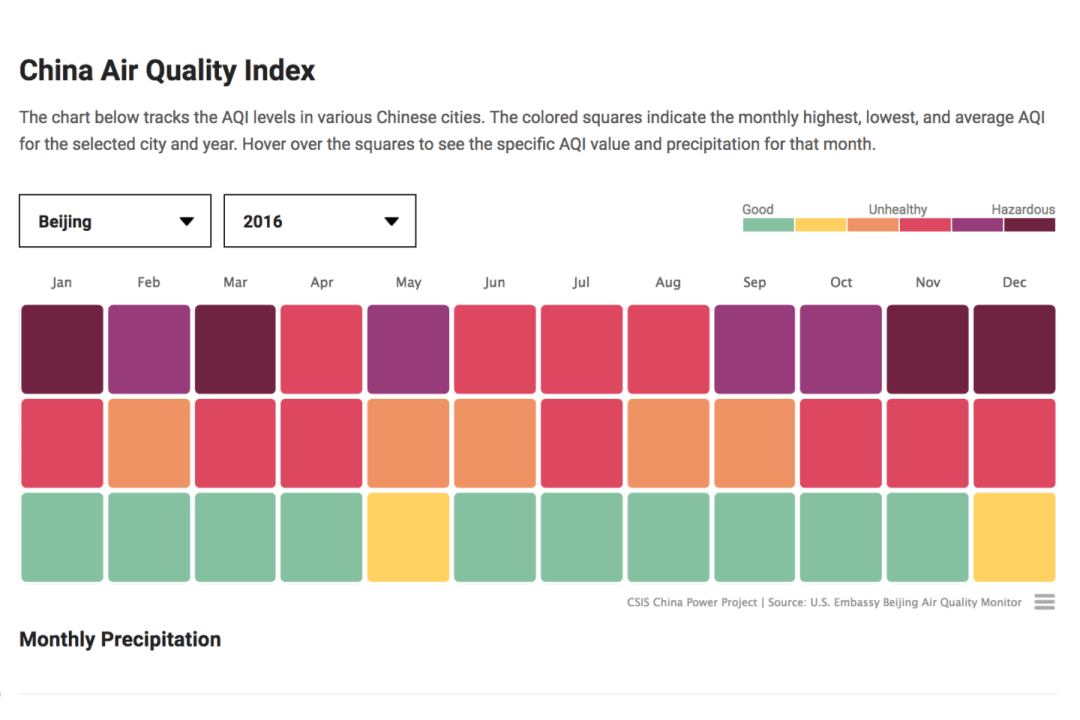
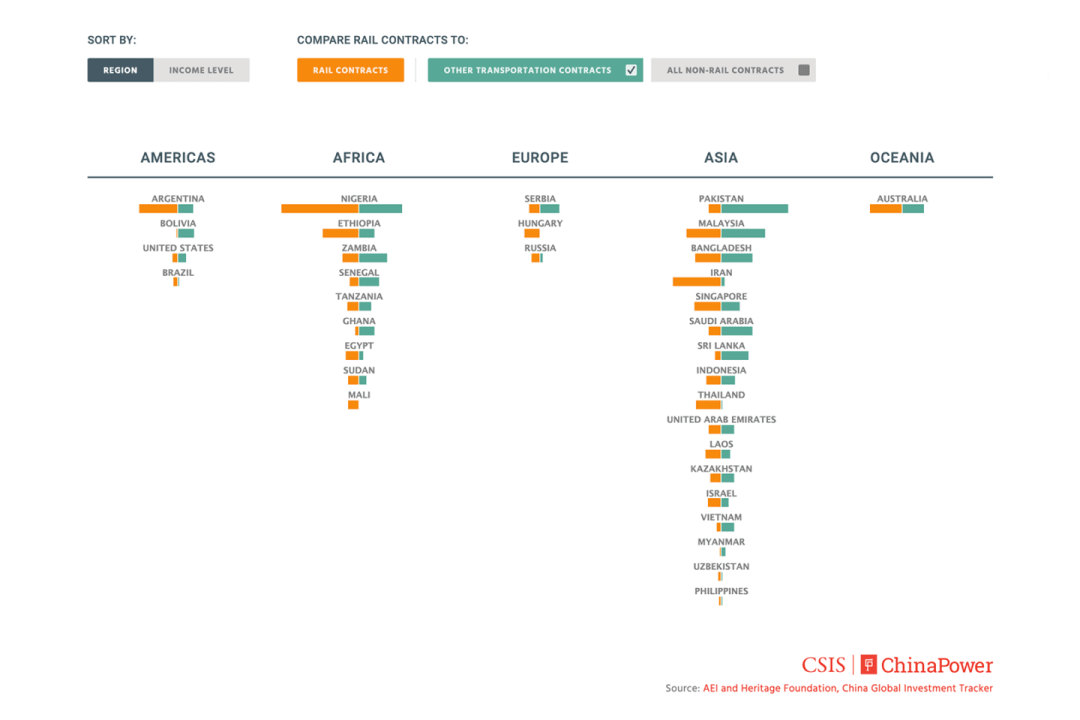
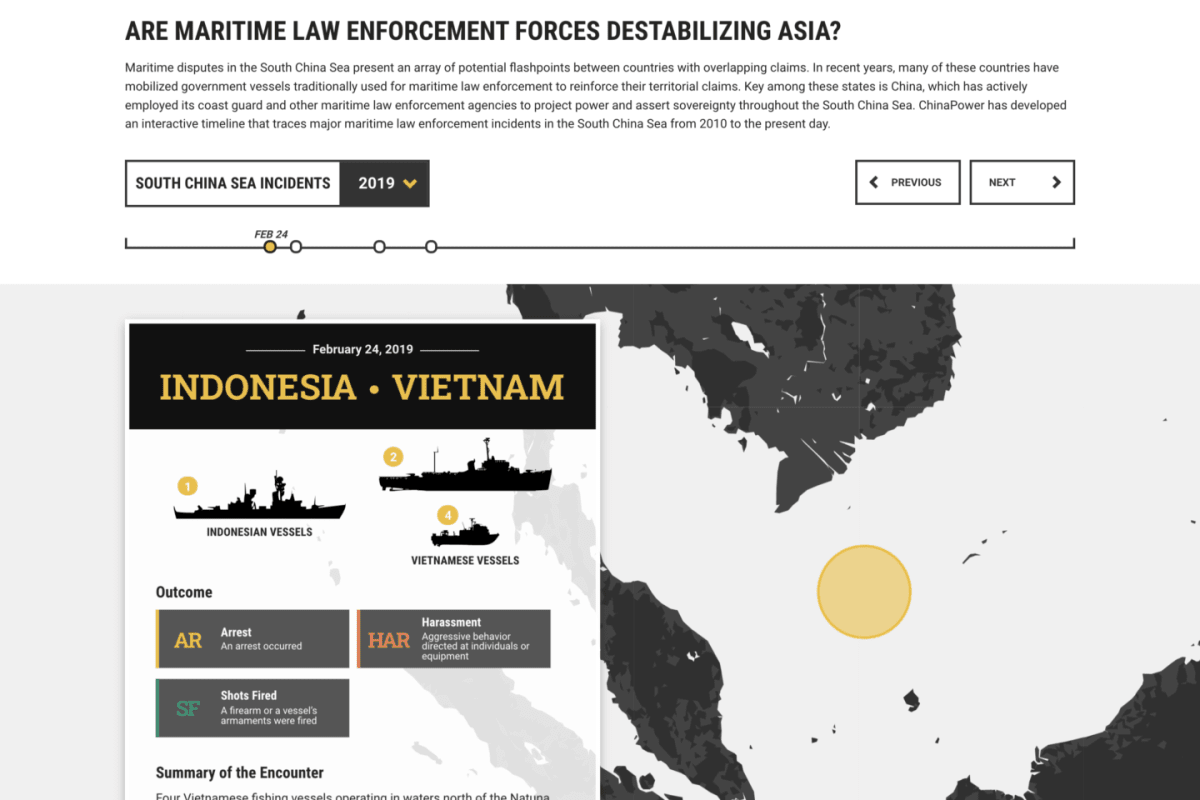
As the lead engineer and designer for CSIS’s ChinaPower Project, I designed and developed a suite of interactive data visualizations that brought complex geopolitical concepts to life for a broad audience. Working closely with researchers, I translated original datasets and academic insights into engaging, exploratory tools that helped users better understand the multifaceted nature of Chinese power—from economic clout to global image. The project’s emphasis on interactivity and clarity made it a widely recognized and awarded resource.
My Role
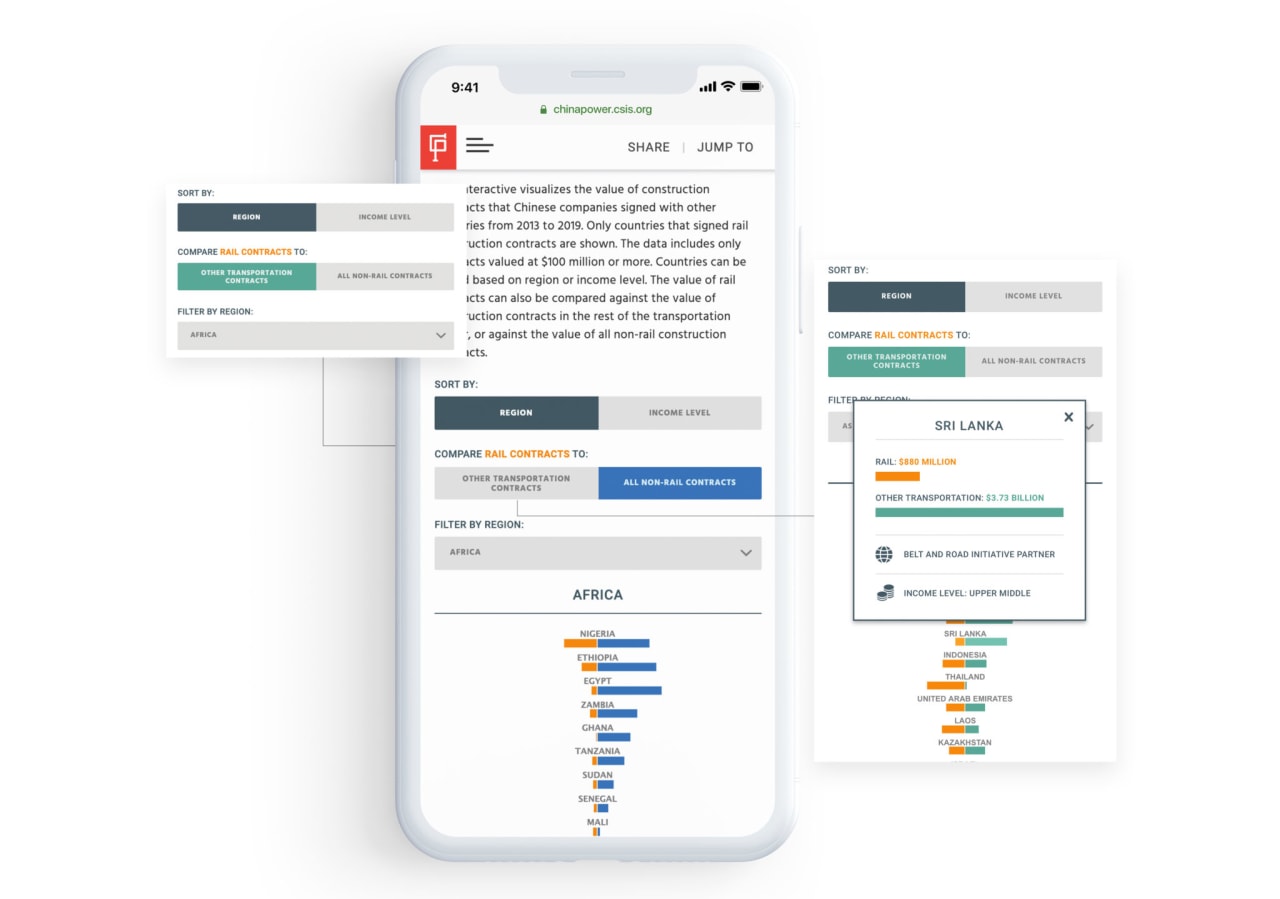
I led the full visual design process, crafting the interface, color system, typographic hierarchy, and data visualization patterns to ensure visual coherence and accessibility across all modules. I implemented all front-end engineering using React, D3, SVG, Highcharts, and Google Maps API, building tools that could dynamically surface insights and adapt across form factors. My work was featured in multiple releases of the project over several years, each expanding the scope and refining the presentation of ChinaPower’s research.
Exploratory Data Analysis
In support of the research team, I also performed exploratory data analysis using R and Python to evaluate and shape the stories we could tell. My technical and editorial skills helped bridge the gap between data and narrative, ensuring that each visualization was both analytically robust and user-focused. This collaborative, interdisciplinary approach enabled the ChinaPower Project to serve not only scholars and policymakers, but also students, journalists, and the broader public.